
Who is winning the race for online visibility in the technology sector? Which brands are struggling to optimise their customer journeys and how do technology brands fare when ranked by trust, relevancy and engagement? Our technology sector report is out now.
At Stickyeyes, we’ve invested heavily to build the tools we need to help our clients be the best in the business. Our enterprise-level tech suite means we have a wealth of data at our fingertips so we make the right decisions for the long-term, often starting with a thorough understanding of any market landscape.
Our latest report draws on this tech suite to analyse 50 of the best and well-known technology brands online including Oracle, Cisco, Intel, RS Components, Texas Instruments and Farnell, as well as those with an interesting search story to tell.
Our analysis benchmarks a brands performance across:
- Website content
- Technical platform
- UX
- Offsite authority
So, which brands are winning, and who is missing out in the race for online visibility? We summarise our key findings.

Trust and authority aren’t an issue in this sector but, there is so much more the leading brands could do be doing to maximise their online visibility
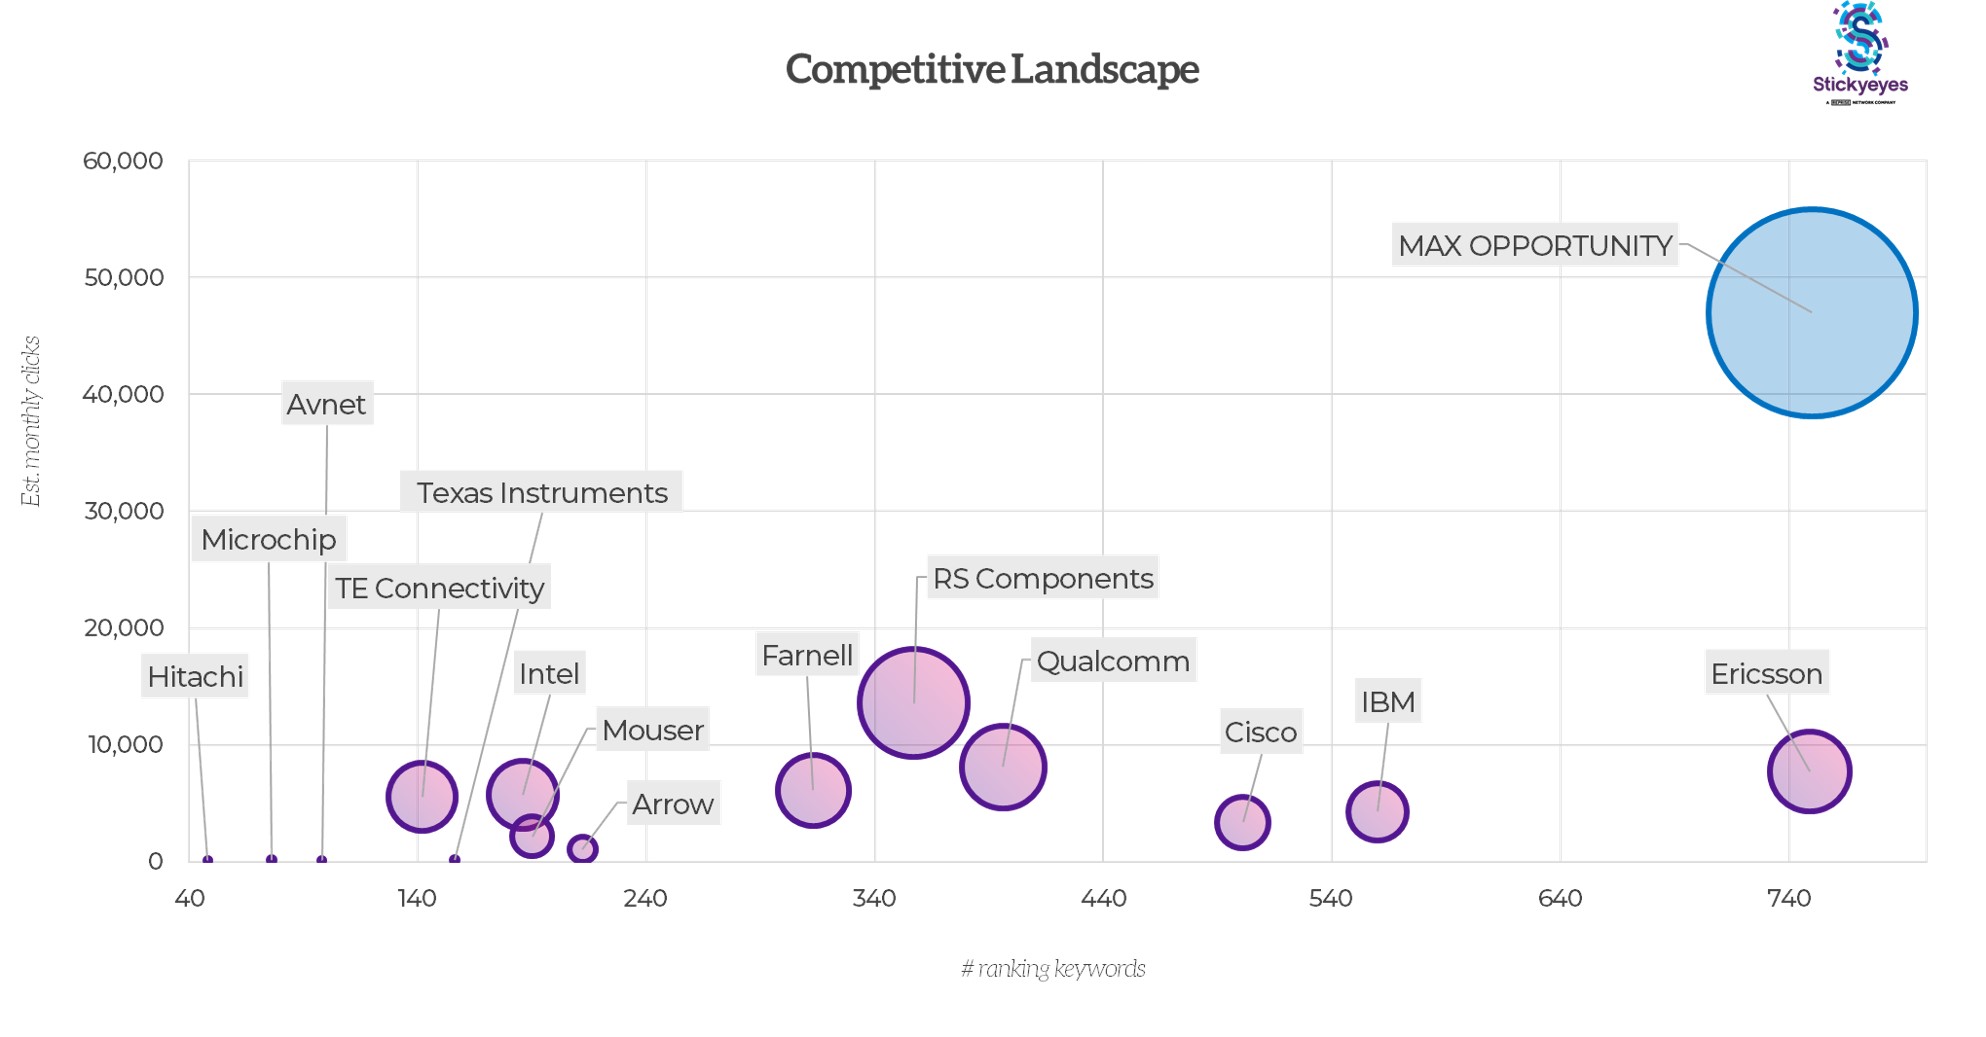
Our report analyses over 5.5k commercially important keywords to see who is ranking across products and categories such as ‘amplifiers’, ‘lighting components’ and ‘circuit protection’ as well as thought leadership topics including ‘internet of things’, ‘aerospace technologies’ and ‘artificial intelligence’.
RS Components top our rankings generating an organic visibility of 13,571 but, it is interesting to note that this visibility comes from just 357 ranking keywords. The likes of Cisco, IBM and Ericsson have a much wider ranked keyword set and appear to be doing well with much more. Whilst Qualcomm is the second most visible brand behind RS Components, their keyword set is nearly half that of Ericsson in position 3 so, it’s evident that there are huge commercial opportunities being missed by all the top tier brands.
Interestingly, as our TRUE analysis shows, trust and authority signals aren’t a major issue. However, we do see brands engaging with link building campaigns which are not as natural as they could be. Brands are missing the opportunity to leverage their extensive content assets for PR purposes. Much of the insightful content could be easily tailored and used as outreach material to gain additional SEO visibility which could be refined to target a number of their different audiences.
Focus on brochureware sites leads to poor information architecture and challenging user experiences
Although many of the sites we analysed were in good shape there were a number of areas for quick-wins throughout the competitive set relating to page speed, website hierarchy and crawlability errors.
A tendency to revert to brochureware site structures causing site speed issues throughout our competitor set. Often there was particular overkill on product pages and an evident lack of information on category pages. This was often an issue on mobile for brands including Avnet, Microsemi, Hitachi and Microchip.
We found a clear divide between brands who ranked well on urgency factors such as CTA’s, live chat and clear value propositions and those who lacked the urgency elements to encourage users to use their services over competitors. Site navigation was also convoluted on many of the sites we analysed meaning users have to click many times to find a specific sub-category or product page with key product information, including out of date serial numbers, often split across multiple pages.
It’s clear that some of the brands in this sector are faced with huge challenges due to the size of their operations. Long development queues, stakeholders to win over to get changes made and alignment with different department on content decisions are leading to some obvious wins being missed. But, with Google’s recent algorithm announcement that page experience will become an even more important ranking factor from 2021, it’s even more important to remedy these challenges quickly.
Content depth and relevancy is the biggest challenge for the technology sector
When we analyse content marketing strategies, many sectors struggle to create and publish content but, the technology sector are miles ahead in this respect. Conferences and campaigns are numerous but sadly many of these don’t make it out of their PDF’s. Here we see large images for blog posts and unlinked/unreadable content, which isn’t crawlable by search engines, for product pages and services pages or, in some cases 50 word overviews on AI for thought-leadership content.
Brands are creating brilliant assets but, it would be advantageous for many in this space to build out the level of content on these pages to bring their functional (e.g category pages) content to the forefront. Brands could also maximise their authority further through a focus on author biographies to position them as the experts across a range of important topics, a key factor in Google’s EAT update of last year.
Read our blog post on how to create content for Google’s EAT algorithm.
How do we work out our rankings?
Our results track the amount of keywords a brand ranks for alongside the amount of traffic a brand can typically expect to build up using Google Keyword search volumes and our own click rate modeling. Terms that rank well are attributed a higher % of clicks and the level of clicks also determine the size of the circle.
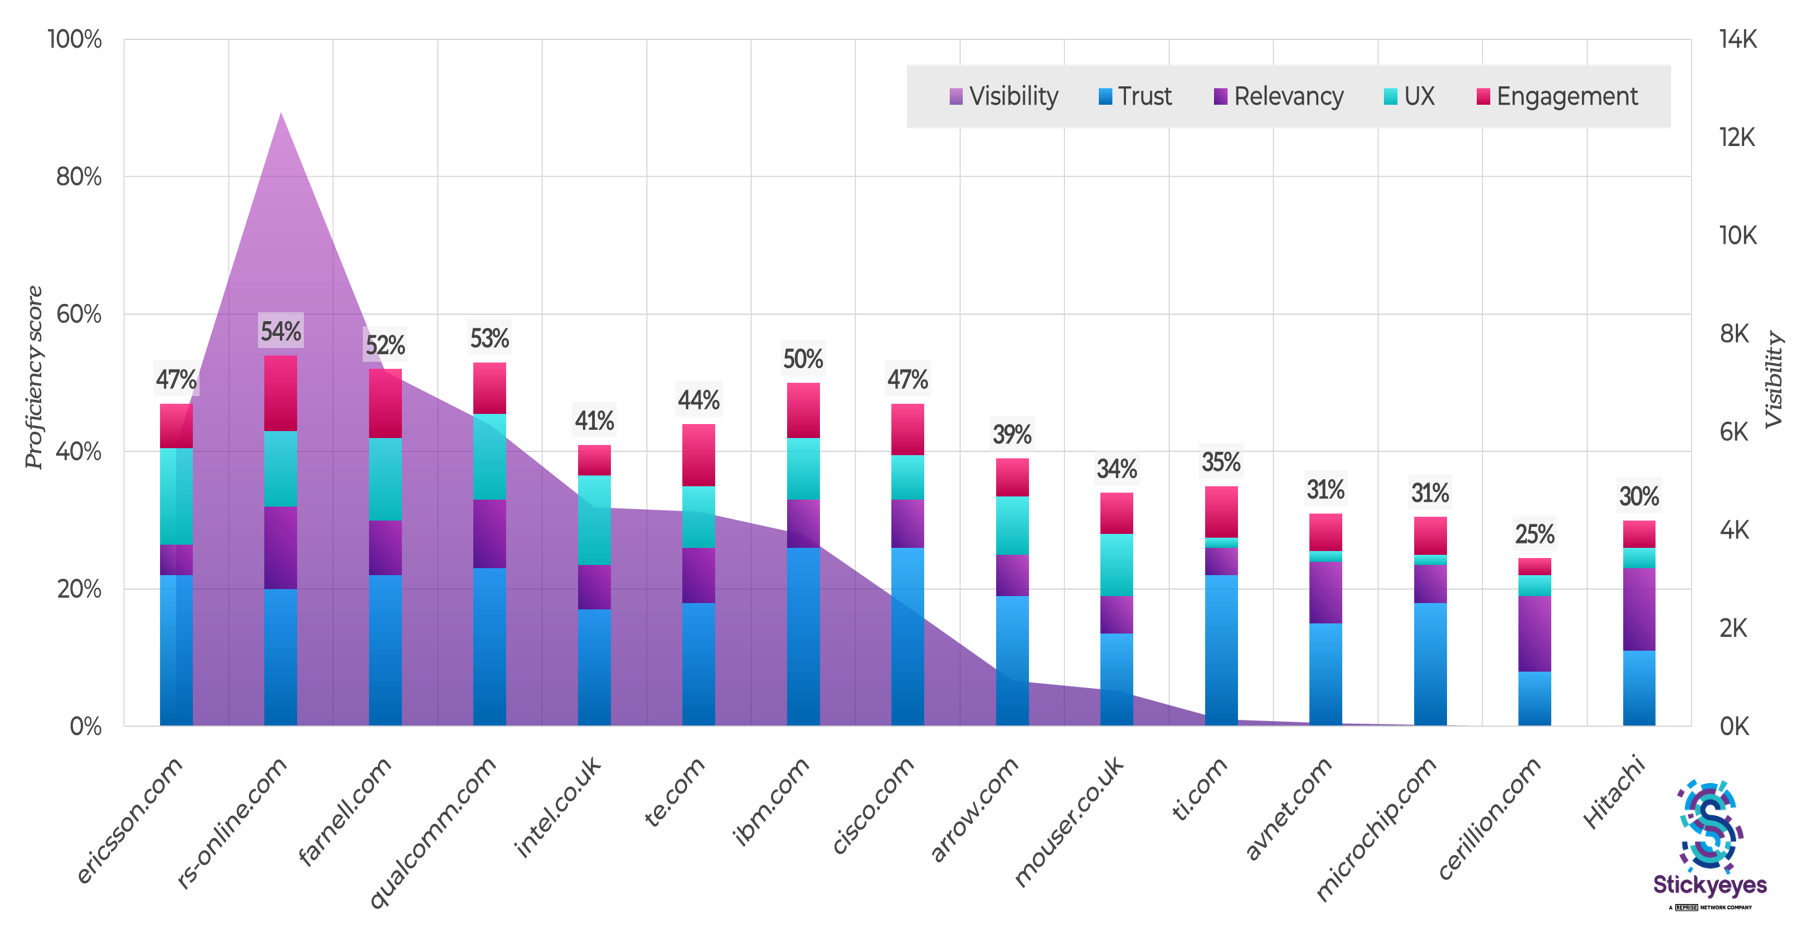
We also look at why brands rank where they do for the range of keywords using our TRUE framework:
- Trust and Authority – looks at the level of online brand awareness, links and citations.
- Relevancy – Content depth and relevancy on website pages.
- UX – Key user experience metrics such as speed and technical standards.
- Engagement – How users interact with the site and the content on it.